The main task of every trader in the Forex market is money making. To achieve maximum results you have to know analysis of historical data to be able to determine future trend. Package of standard tools in the “MetaTrader” platform allows you effectively analyze the price trend.
What is the technical analysis in Forex
Forex technical analysis is a research method, allowing to predict future price movements of an asset based on historical data of such asset. Technical analysis serves as a basis for making the right (profitable) decision. Technical analysis makes it possible to determine entry points and profits fixing.
Classification of trader’s tools for technical analysis
Technical analysis tools are divided into following groups:
- Graphical tools. You have to know how to construct, find and analyze graphical models on trend to predict the future price using such instruments (for example, pennant, triple top, Fibonacci fan and others);
- Approximation tools and filters. The main point of these tools consists in following and advancing the trend using computer programs based on the mathematical calculations such Fourier series;
- Cycles. As you know the Forex market is characterized by its cycle. In other words, events in the past will repeat at preset. A good example of such tools is Elliott Wave Principle.
Linear tools
Linear tools of technical analysis are described by a set of lines: vertical, horizontal and trend.
Vertical lines serve as a good reference point of new trading session opening and the mark of important news reports.
Horizontal lines allow you to draw price channel on the trend (support and resistance line). When the price hits these levels is a sign of a trend change in the Forex market.
Trend lines allows assess the current trend. Some traders build these lines at an angle. There is a belief that the higher the degree of the angle, the stronger the trend. The trend at 45° angle is a highly directional trend.
Forex channel analysis
We can make channel analysis in Forex using Fibonacci sequence or linear regression channel.
Fibonacci channel consists of support and resistance levels, bouncing of which signals about currency buying or selling.
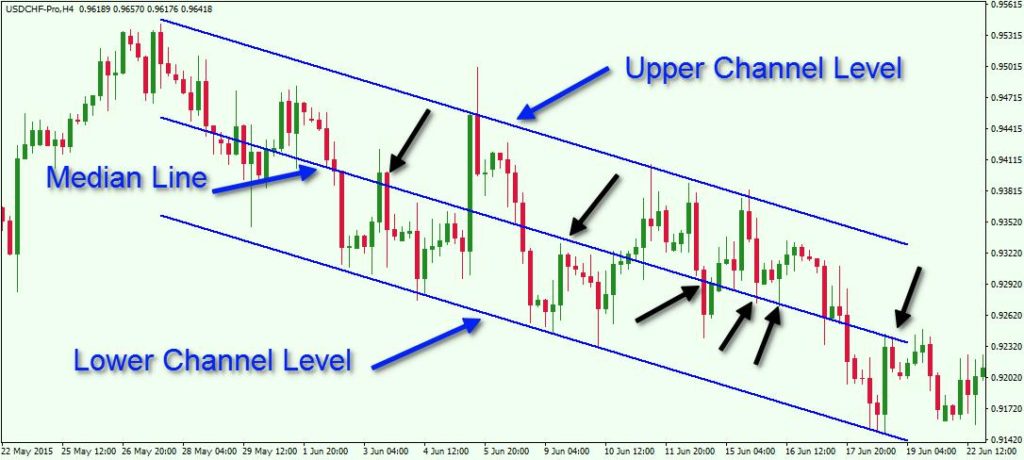
Linear regression channel consists of parallel lines (3 lines in total). Median line is the market equilibrium price. Any, even slight variance up or down of this line indicates to bullish/bearish activity in the Forex market. In addition to regression channel, traders apply equidistant channel in their trading, built on the basis of two parallel lines on maximum/minimum points of candles’ close.
Gann, Fibonacci and Elliott tools
Gann tools comprise:
- Gann Fan
- Gann Lines
- Gann Grid
Tools idea is almost the same: mail line is segment, project at an angle of 45° to Х and Y axis (time and value). If the trend is ABOVE the given line, the trend is ascending, UNDER the line – descending.
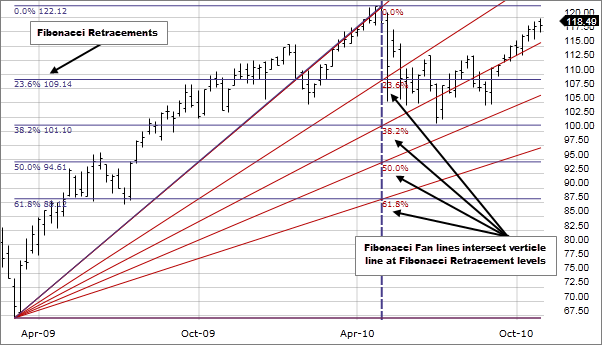
Fibonacci fan shows support and resistance levels along with price retracement in the Forex market.
Fibonacci tools
- Fibonacci Times Zones
- Fibonacci arcs
- Fibonacci Channel
- Fibonacci Grid
- Fibonacci Fan
Elliot tools are the basis for wave analysis in “MetaTrader”. Impulse and corrective waves are presented in menu Insert. Impulse wave enables to analyze directional trend, the corrective one – to trace the pullback to trade against the trend.
Chart patterns and tools of technical analysis
Apart from main technical analysis tool there are chart patterns. In most cases such patterns are used for indicating significant marks on the chart and allow to improve the overall visualization.
Triangle
Brilliant
Double top
Wedge
Triple Bottom
Triple Top
Double bottom
Flag
Rounding Bottom or Saucer Bottom
Pennant
Technical indicators
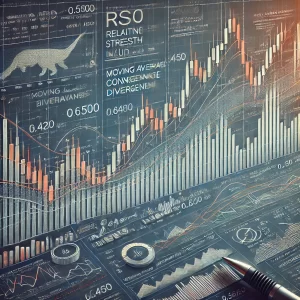
We can consider indicators as main tools for technical analysis. As advised by experts the most efficient are: “Mоving Avеragе” (calculates average price for a defined time period), “Bollinger Bands”, “MACD”, “RSI” (used to analyze overbought /oversold conditions).
In any case, using indicators and other tools for analysis in Forex, do not revolve around one or two. It is important to learn how to combine obtained indicators in order to improve forecasting effectiveness.