Japanese candlestick represents characteristics of price movements of a trading instrument during a certain time period. It was discovered in the XVIII century in Japan. The candlestick represents a wide rectangle which is called “real body” with upper and lower sections, which are called “shadows” or “wicks”.
Japanese candlesticks in the system of coordinates, where X-axis represents time and Y-axis represents price quotation of an instrument, form quite informative chart of price movements. Each chart element shows a character of price fluctuations in one of the equal time intervals defined by a selected timeframe.
The upper shadow of the candlestick shows the maximum (high) price of the instrument for the given time period. Conversely, free end of the lower shadow points to bottom (low) price for the given time period.
One of the horizontal border of the candlestick real body is at the level of open price, the other one – at the level of close rice of that period.
If the close price is higher than open, the candlestick is called rising or bullish. If, conversely the open price is higher than close price, such candlestick is called falling or bearish. Bodies of all bullish patterns are filled in one color and bearish patters are with other. Usually trading platforms allows you to choose any color pairs for candlesticks, but traditionally traders prefer white (green) color for bullish and black (red) color for bearish patterns.
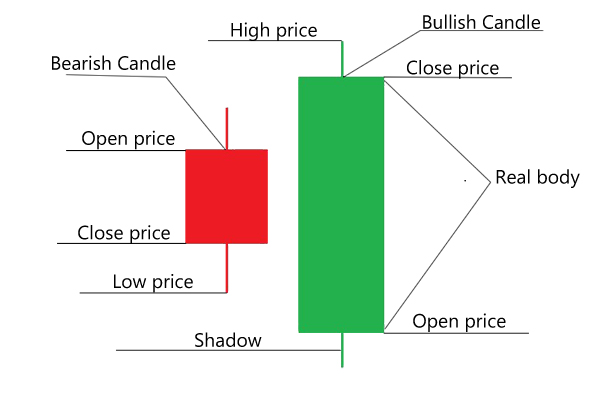
Japanese candlesticks structure
There are times when open price and (or) close price coincide with minimum/maximum price of time period. Then one or both shadows are absent. Candlestick without shadows is called marubozu.
Candlesticks with very small real bodies as compared to their shadows or when open and close prices are equal, such candlesticks are called doji.
There is a hypothesis that according to the candlestick shape, or a candlesticks combination of a certain shape we can most likely predict price behavior in the future. In technical analysis it is called a candlestick charting technique.
Candlestick or combination of candlesticks, enabling to make some analytical conclusions, are called candlestick patterns. There are dozens (or maybe hundreds) of different candlestick patterns and their variations. Let’s consider the most effective patterns.
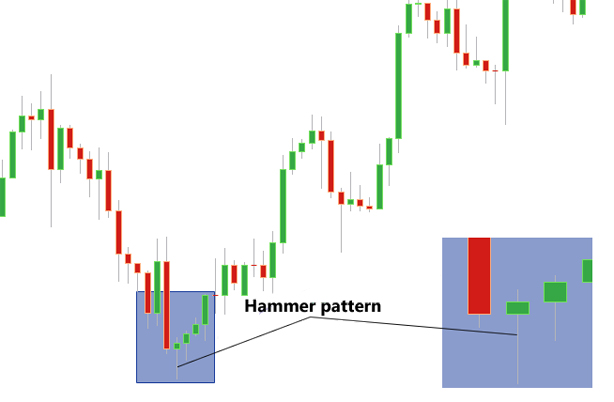
Hammer pattern
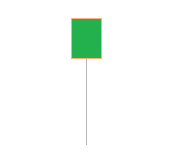
“Hammer” is a candlestick with relatively short body and long (at least two times as large) lower shadow. In such pattern upper shadow is very little or absent. The hammer is formed on descending trend, as a rule on its way to strong support level (the most attractive variant when lower shadow touches or even hits the support level, and candlestick closes above such level). It doesn’t matter what the color is at the moment, however bullish is more preferred variant.
Hammer candlestick pattern
The hammer pattern is rather strong reversal signal to upward trend, especially when the candlestick is followed by the bullish with long body.
Hanging Man pattern
 The hanging man pattern has the shape similar to the hammer, but is formed on the uptrend and is a bearish reversal signal. Accordingly, although the body may be of whatever color, it’s better when the pattern has bearish candlestick.
Strength of the reversal signal in the hanging man pattern increases, if the body touches (or better his) important resistance level, and the next candlestick has well-defined bearish body.
Inverted hammer pattern
 Inverted hammer is the pattern similar to the Hammer, but in this case the upper shadow is long and the lower shadow is little or absent. Inverted hammer, appeared on the downtrend, is also a bullish reversal pattern, but weaker than the Hammer (especially when the body of the Inverted hammer is bearish).
If the trader has opened short position at the time of Inverted hammer forming it does make sense to close it or, at least, reduce the volume. It’s better to wait for bullish candlestick with long body following the Inverted hammer to open a new position.
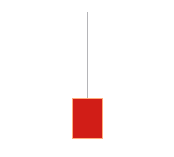
Shooting Star pattern
Shooting stare candle is similar to Inverted hammer, but contrary to the latter, it is formed on an uptrend. Open price of the shooting star must be above the close level of the previous candle. It does’t matter what the candle color in this pattern.
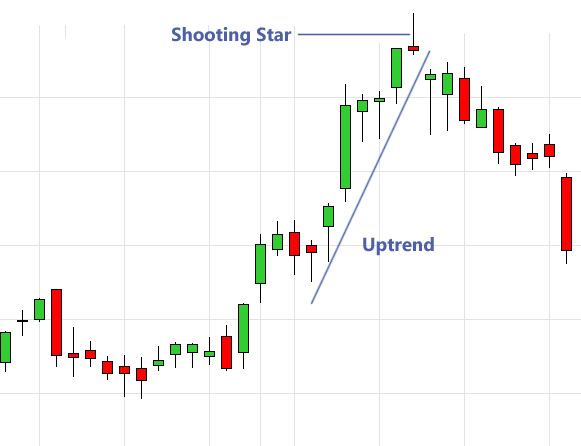
Shooting star is the bearish reversal pattern, but it is considered weaker than the Hanging man (especially when the star body is bullish).
Bullish and Bearish Engulfing patterns
Engulfing is the pattern of two candles of different colors. First Bullish engulfing candle must be falling and the second one – rising. In case of Bearish engulfing, accordingly, the order of candles is reversal. Engulfing is deemed to be formed if upper and lower body borders of the second candle are higher and lower of corresponding borders of the first candle. In such a case the first candle must not be doji.
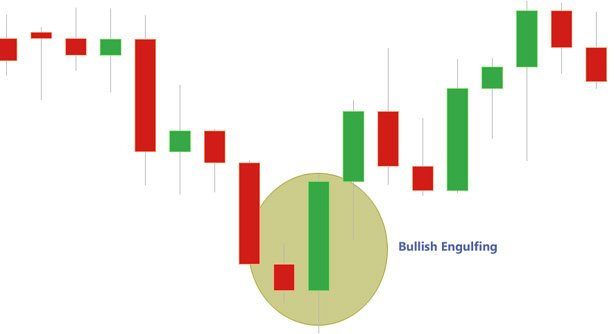
Size of shadows is not important, however the pattern strength increases if the second candle (better both of them) is marubozu. Pattern effectiveness also increases, if the second candle body engulfs not only the body of the first candle but its shadows as well.
Bullish engulfing, forming on the downtrend, is the strong signal of quick upward reversal. Accordingly, Bearish engulfing, forming on the uptrend, signals on the bearish reversal.
Dark Cloud Cover pattern
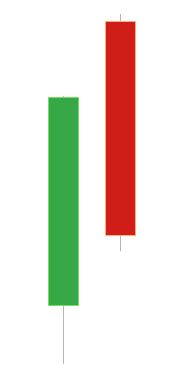 Dark cloud cover is the pattern which outwardly resembles the Bearish engulfing. It involves a couple of candles of different color with large bodies and relatively small shadows (the best variant when the second candle is marubozu). Body size of such candles won’t considerably differ from each other.
The key distinctive feature of this pattern is that open price of the second candle must be higher than close price of the first one. And the close level of the second candle must be lower than center of the first candle body.
Dark cloud cover forms during uptrend, is a bearish reversal pattern, but weaker than Bearish engulfing. Dark cloud cover strength increases if the first candle hits important resistance level as it closes, and the second one hits it inversely.
Harami pattern
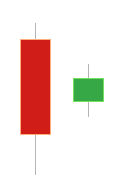 One more double candlestick pattern is Harami. This pattern has a large body in the first candle which fully cover the second candle body (better when it covers body and shadows). Traditionally it is assumed that the first candle of bullish Harami must be bearish, the second – bullish (for bearish Harami – vice versa). However, today many analysts tend to assert that Harami candle colors in fact have little impact on this pattern efficiency. It is much more important of to what extent the body of the second candle is smaller than the first one. The best variant of such pattern is when the second candle forms doji.
Harami is a reversal pattern, its direction depends on the trend it forms. Having emerged from the downtrend development, Harami serves a signal of potential bullish reversal, and emergence of this pattern during the uptrend foreshows, correspondingly, a potential bearish reversal.
Morning star pattern
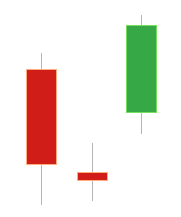 Morning star is a pattern of three consecutive candles, where first and third one have large bodies, first candle is bearish, second is bullish. The second candle in the pattern (which is actually called a “star”) has relatively short shadows and small body (doji with short shadows is the best variant). Color of the middle candle is of no importance.
The pattern forms if the open price of the second candle is less than close price of the first one. In its turn, third candle close level must be above the middle part of the first candle body.
Morning Star is more effective when the close price of the third candle is as high as possible. Besides, the pattern strength increases, if the open level of the third candle is higher than the close level of the middle candle.
The Morning Star, formed on a downtrend, is quite strong bullish reversal pattern.
Evening star pattern
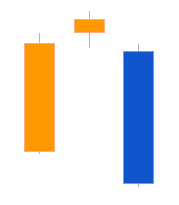 Evening Star is a reverse pattern of the Morning Star.
The pattern also consists of three candles. First candle must be bullish, the third – bearish. Moreover it is essential that the first and third candles have sufficiently large bodies. Color of the middle candle is of no importance. Its body should be as small as possible (ideally – doji). Middle candle shadows must be relatively short.
Prerequisites for the model formation are:
– open price of the second candle is higher than the close price of the first;
– close price of the third candle is below the middle body of the first candle.
Evening star emerging on the uptrend is a signal to potential bearish reversal. The lower close level of the middle candle, the higher probability of reversal scenario. Strength of this pattern is also considered, if the open price of the third candle is lower than the close price of the second one.
It is obvious that the candlestick analysis is wider and not limited to patterns mentioned in this tutorial. You can find many examples of candlestick patterns in the book of Steve Nison “Japanese candlestick charting techniques”. You can download the Second Edition of this book in PDF from our site by the following link – https://tradingforexadvisor.com/media/Japanese Candlestick Charting Techniques by Steve Nison.pdf
In conclusion, I feel it my duty to notice that candlestick analysis is undoubtedly effective and time proved technical analysis technique, but you should consider several important principles:
– trust reversal patterns if and only if they form close to strong support or resistance levels;
– if during a current trend the pattern has already appeared without any result, strength of such pattern will suddenly drop in subsequent emergences;
– the reversal pattern is stronger if the previous trend is longer and stronger;
– candlestick analysis is often insufficiently effective on small timeframes;
– do not consider candlestick analysis patterns as direct trading signals. They more likely serve as determinants of a general market state. Make decision about position opening and entry point selection using additional technical analysis tools.