The Euro is strengthening versus the dollar. There are some clear online trading technical signs that the currency pair is beginning to break down. Part of the move is fundamental. During geopolitical strife, the dollar generally gets a safe-haven bid. U.S. Treasury yields are declining as investors look to the United States as a place to hold their capital as Russia continues its onslaught of Ukraine. The technicals show weekly there is further to fall as the daily chart of the EUR/USD starts to break down through support levels.
Technical Analysis
There are several ways to analyze and create a view of where a currency pair will go in the future. One of the most widely used techniques is technical analysis. Technical analysis is the study of past price movements to help determine the future trends of an asset. Technical analysis can be categorized into three different types of methods: support and resistance techniques, patterns, and studies.
Support and resistance use trend lines and highs and lows along with moving averages to find levels where a currency pair is having difficulty gaining or losing ground. Patterns reflect a combination of movements in the exchange rate that are familiar and usually lead to a specific change in the direction of a currency pair. Studies are mathematical and statistical calculations of the exchange rate movement that provide you with a process or index that can help determine the trend or momentum of the underlying exchange rate.
EUR/USD Technical Analysis
The EUR/USD is experiencing a change as the dollar benefits from safe-haven flows. The attack on Ukraine by Russia is helping the dollar gain traction.
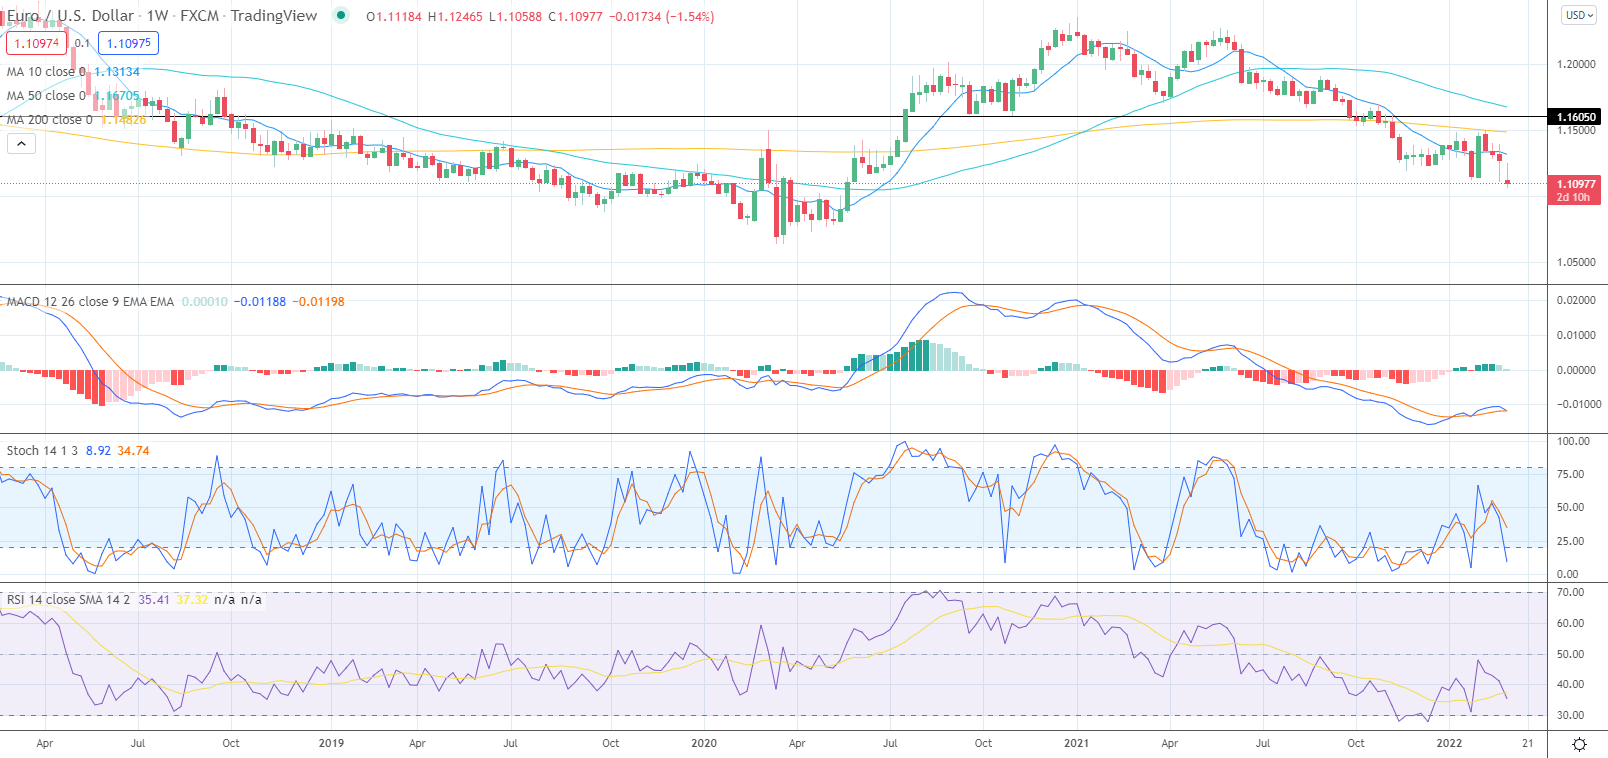
To have a better view of what is happening, we will first take a look at the weekly chart of EUR/USD. This chart will provide a broader idea of the trend in the exchange rate price. The EUR/USD is breaking down through the February lows. These levels near 1.1270 are former support which is now considered resistance. Support is a level below which the exchange rate has difficulty moving, whereas resistance is when an exchange rate has a challenging time moving above. Resistance is also seen near the 10-week moving average of the EUR/USD, near 1.1313. The target support on the weekly chart of the EUR/USD is near the March 2020 lows seen near 1.0697.
There are several studies listed in the charts. The middle analysis is called the fast stochastic. The fast stochastic evaluates the movements of the currency pair over a short period and creates an oscillator that moves below 1-100. Levels above 80 show that the underlying exchange rate is overbought. Levels below 20 show that the exchange rate is oversold. When the fast stochastic crosses below the signal line, a sell signal is generated and a negative momentum accelerates. When the fast stochastic crosses above the signal line, it reflects a scenario of accelerating the positive rate. The weekly stochastic is printing a reading of 9, below the oversold trigger level of 20. A reading of 9 could foreshadow a correction in the exchange rate.
The bottom study is the relative strength index. This study is also a momentum oscillator. Levels below 30 are considered oversold. Levels above 70 are thought to be overbought. The current level of 35 is on the lower end of the neutral range. The decline in the RSI shows that negative momentum is accelerating.
The top study is the Moving Average Convergence Divergence index. This study shows changes in momentum. There is the MACD line and the MACD histogram. The MACD line generates buy and sell signals. A sell signal occurs when the MACD line (the 12-week moving average minus the 26-week moving average) crosses below the MACD signal line (the 9-week moving average) MACD line. A buy signal occurs when the MACD line crosses above the MACD signal line.
In the weekly chart of EUR/USD, the MACD line crosses below the MACD signal line, which shows that a weekly sell signal is occurring.
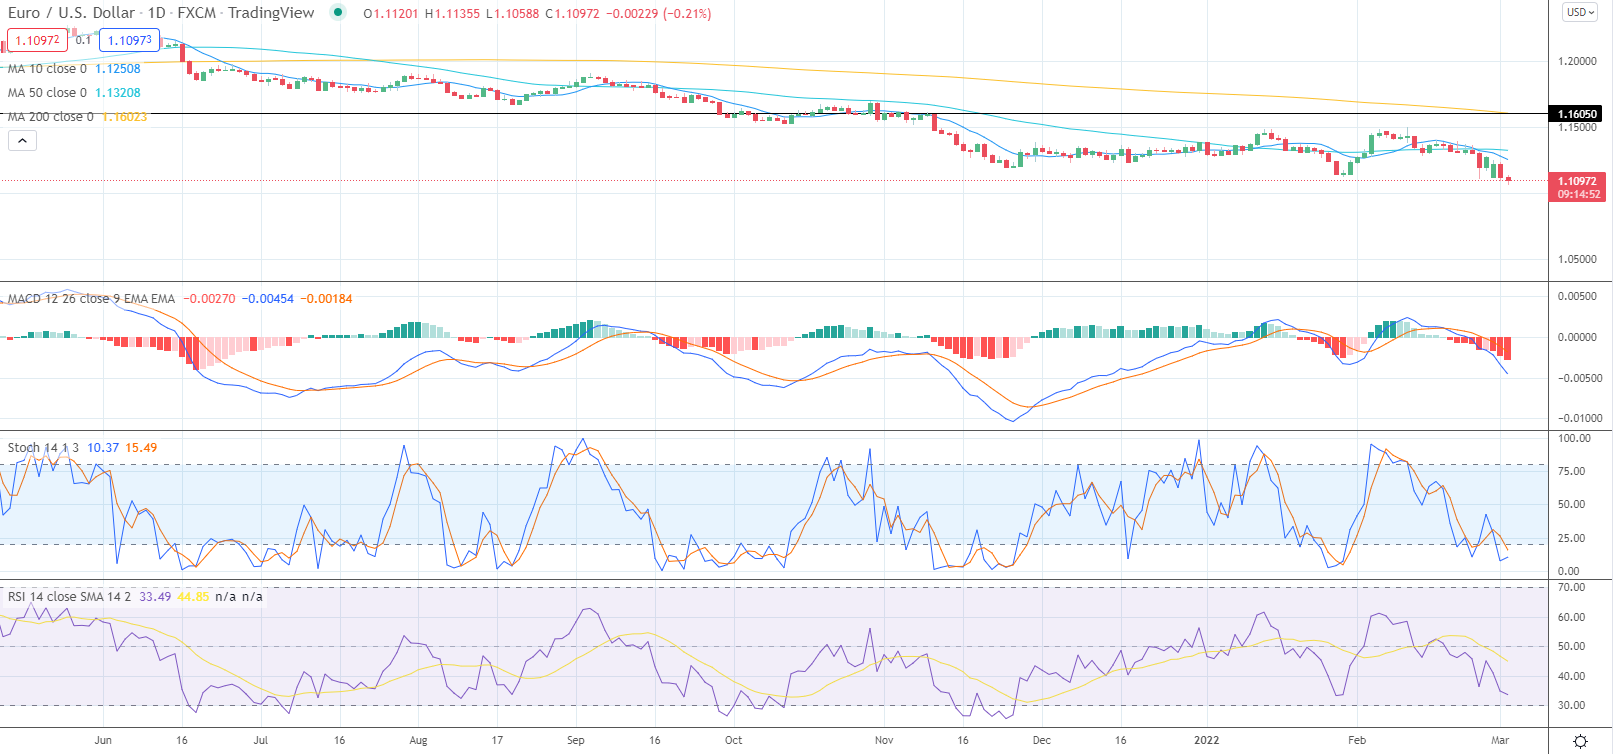
The daily chart of EUR/USD has slipped through the January lows, which are likely seen as resistance. The 10-day moving average has crossed through the 50-day moving average, which means a short-term downtrend is now in place. The fast stochastic is printing a reading of 10, which means the exchange rate is oversold. The RSI is printing a reading of 33, just above the oversold trigger level of 30. The MACD histogram is printing in negative territory with a downward sloping trajectory which points to a lower exchange rate.
The Bottom Line
The upshot is that the technical picture for the EUR/USD is negative. Momentum indicators point to a lower exchange rate on both the weekly and daily charts. While the fast stochastic is oversold, prices can remain oversold for an extended period. The trend points to a future rally in the greenback. However, only time will tell where it actually heads next.