Introduction
Technical analysis is an essential skill for forex traders. Unlike fundamental analysis, which considers economic indicators, technical analysis relies on historical price data and statistical trends. By understanding how prices move and identifying recurring patterns, traders can make informed decisions and develop strategies that give them an edge in the forex market.
What Is Technical Analysis?
Technical analysis is a method of evaluating securities by analyzing price movements and volume. It assumes that all known information is already reflected in the market price, making the price itself the most crucial indicator. Traders use charts and technical tools to identify potential trading opportunities based on past performance.
Core Principles Of Technical Analysis
The foundation of technical analysis lies in three core principles. First, the market discounts everything, meaning all factors affecting price are already priced in. Second, price moves in trends; once a trend is established, it is more likely to continue than reverse. Third, history tends to repeat itself due to consistent market psychology.
Understanding Forex Charts
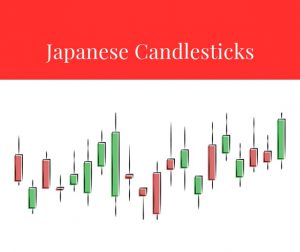
There are three main types of forex charts used by traders: line charts, bar charts, and candlestick charts. Line charts show closing prices over a time period and are good for observing overall trends. Bar charts include open, high, low, and close values, offering more detail. Candlestick charts provide the same information but with visual cues that help identify patterns and potential reversals.
Candlestick Patterns Explained
Candlestick patterns are essential for predicting price movements. A Doji indicates market indecision, often signaling a possible reversal. The Hammer and Inverted Hammer suggest bullish reversals after a downtrend. Engulfing patterns—where a small candle is followed by a larger one that fully engulfs it—signal strong reversals and are valuable tools for traders.
Key Technical Indicators And Tools
Successful traders rely on technical indicators to make trading decisions. Moving Averages, such as the SMA and EMA, help identify trend direction. The Relative Strength Index (RSI) measures the strength and momentum of a trend. MACD is used to reveal changes in trend momentum, while Bollinger Bands help determine overbought or oversold conditions. The Stochastic Oscillator helps identify potential trend reversals.
Chart Patterns Every Trader Should Know
Recognizing chart patterns is key to predicting future price behavior. Patterns like Head and Shoulders and Double Tops/Bottoms are common reversal signals. Triangles (ascending, descending, and symmetrical) indicate periods of consolidation and potential breakout points. Flags and Pennants suggest continuation of the current trend after a brief consolidation.
Support And Resistance Levels
Support and resistance levels are crucial for planning entries and exits. A support level is where the price tends to find a floor as buying pressure increases, while resistance is a ceiling where selling pressure builds. Identifying these levels helps traders place stop-losses and take-profits more effectively.
Moving Averages And Crossovers
Moving averages smooth out price data and help identify trends. The Simple Moving Average (SMA) calculates the average price over a set time, while the Exponential Moving Average (EMA) gives more weight to recent prices. A Golden Cross occurs when a short-term average crosses above a long-term average, signaling a bullish trend, while a Death Cross indicates a bearish trend.
Oscillators: RSI, MACD And Stochastic
Oscillators are momentum indicators that help identify overbought and oversold conditions. The RSI ranges from 0 to 100, with values above 70 suggesting overbought conditions. MACD shows the relationship between two moving averages and can help detect trend reversals. The Stochastic Oscillator compares a particular closing price to a range of prices over time.
Fibonacci Tools And Retracements
Fibonacci retracements help traders identify potential reversal levels. The key levels—23.6%, 38.2%, 50%, and 61.8%—are derived from the Fibonacci sequence and are often areas where prices temporarily retrace before continuing their original trend. These levels are used to place entry, stop, and limit orders.
Multi-Time Frame Analysis
Looking at multiple time frames allows traders to get a broader view of the market. A trader might use a longer time frame to understand the trend and a shorter one to time their entry. This approach provides better context and reduces the chances of false signals.
Developing A Technical Trading Strategy
A robust technical trading strategy involves selecting a trading style, such as scalping, day trading, or swing trading. Traders define their entry and exit rules based on indicators, implement risk management practices like stop-losses and proper position sizing, and backtest their strategy using historical data to assess performance.
Risk Management With Technical Signals
Risk management is as important as the strategy itself. Technical signals help set stop-loss and take-profit levels. A trailing stop allows the stop-loss to move with the price, protecting profits. Proper risk management ensures that no single trade can severely damage the trader’s account.
Combining Technical And Fundamental Analysis
While some traders prefer one method over the other, combining technical and fundamental analysis often yields better results. Traders can use fundamental analysis to choose which assets to trade and technical analysis to determine the best time to enter or exit a position.
Common Mistakes And How To Avoid Them?
Many beginners make mistakes such as overcomplicating strategies, ignoring risk management, or reacting emotionally. Others chase trades without proper setups. These errors can be avoided by following a consistent trading plan, using a trading journal, and constantly reviewing performance.
Best Practices For Technical Traders
Successful traders maintain discipline, continually learn, and optimize their strategies. Keeping a trading journal, sticking to a tested plan, and staying informed about market news are essential habits. Backtesting and regularly reviewing trades help refine approaches and increase profitability.
Advanced Techniques And Backtesting
Advanced traders may use algorithmic trading, applying specific rules to enter and exit trades automatically. Backtesting strategies against historical data allows traders to assess their viability. Some also explore machine learning techniques to identify patterns and gain an edge.
Final Thoughts
Technical analysis offers a powerful approach to navigating the forex market, but success ultimately depends on the trader’s discipline and ability to manage risk. By mastering chart patterns, indicators, and strategies, and practicing continuous learning and self-evaluation, traders can significantly improve their chances of success.